| |
PEDSTATS Tutorial -- Pairwise Distributions
When the --pairStatistics option is used in conjunction with the --pdf option, PEDSTATS appends its
standard pdf output with a page of charts summarizing pairwise distributions among first and second degree relative pairs for each
quantitative trait, covariate, or affection
variable in your pedigree file.
Pairwise Summary of Covariate and Quantitative Traits
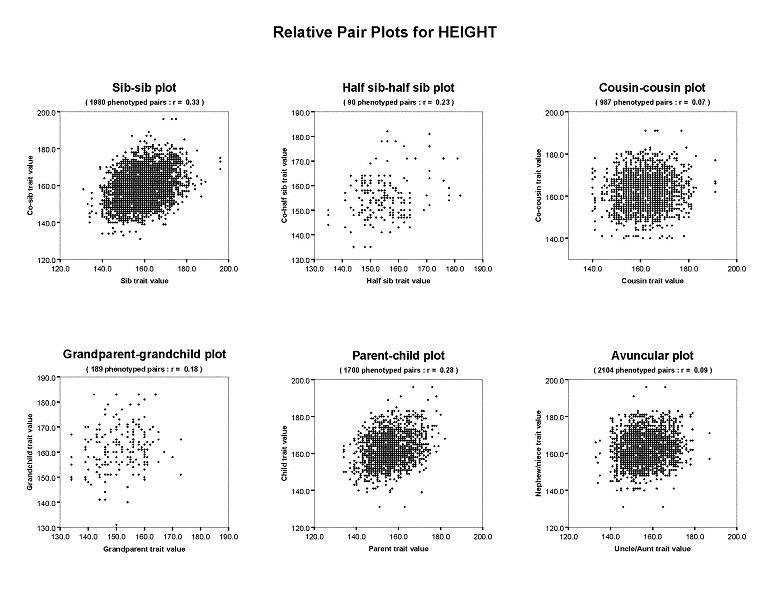
For quantitative traits and covariates, the ploats are arranged in two rows, each with three plots.
In Figure 1, the upper row contains scatter plots showing
the pairwise distribution of HEIGHT for unordered pair types (sib, half-sib and first cousin pairs), while the
bottom row contains the same information for each pair relationship that has an inherent ordering (grandparent-grandchild, parent-child and
avuncular relationships). Pair types in the top row are plotted symmetrically with 2 data points per pair. Values for ordered pair
types are represented by the single data point formed by plotting the ancestor value along the x-axis and the descendant value along
the y-axis. For all pair types, the number of phenotyped pairs
and the correlation are given in the plot title.
Pairwise Summary of Dichotomous Variables
For dichotomous traits, a breakdown of affection status similar to that shown in Figure
2 is given for each relative pair type. Here, each chart shows the number of affected, unaffected and discordant pairs for
the corresponding relative pair type.
| |
